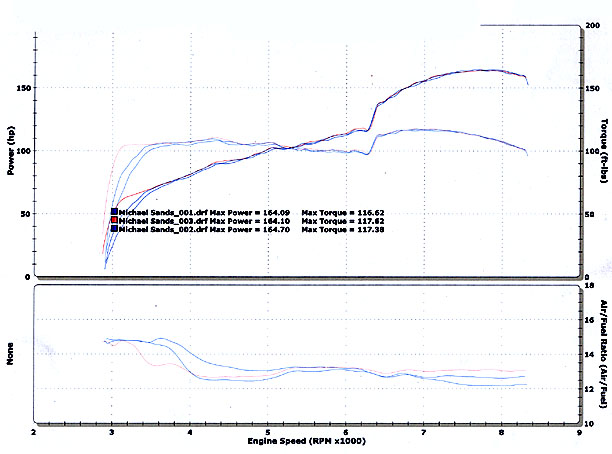
Shift Point Calculations and Speed in Gears
The shift point calculations are based on the dynamometer run for my car. The chart shows the torque to the rear wheels as the engine torque is multiplied by the gear ratios. (I did not use the final drive gear ratio to calculate the real torque at the rear wheels. The number is a constant so the relative magnitude is correct. My thanks to Ben Colley for noticing the error.) The number at the top of the torque in each gear is the ratio of the gear being calculated.
For example, at 2000 rpm, the torque generated at the engine is 96 foot - pounds, and this gets multiplied by first gear's ratio of 3.116 : 1 to get 299 foot - pounds of torque. This should be multiplied by the final drive ratio to get the torque at the rear wheels. The result is a speed of 11 mph.
Assumptions include drive tire size of 225 x 45 x 17 and a circumfrence of 78.45 inches, resulting in 807.61 revs per mile. The final drive ratio is 4.529 : 1.
| rpm | torque | 3.116 | 1st mph | 2.05 | 2nd mph | 1.481 | 3rd mph | 1.166 | 4th mph | 0.916 | 5th mph | 0.815 | 6th mph |
| 2000 | 96 | 299 | 11 | 197 | 16 | 142 | 22 | 112 | 28 | 88 | 36 | 78 | 40 |
| 2500 | 103 | 321 | 13 | 211 | 20 | 153 | 28 | 120 | 35 | 94 | 45 | 84 | 50 |
| 3000 | 107 | 333 | 16 | 219 | 24 | 158 | 33 | 125 | 42 | 98 | 54 | 87 | 60 |
| 3500 | 110 | 343 | 18 | 226 | 28 | 163 | 39 | 128 | 49 | 101 | 63 | 90 | 70 |
| 4000 | 112 | 349 | 21 | 230 | 32 | 166 | 44 | 131 | 56 | 103 | 72 | 91 | 81 |
| 4500 | 112 | 349 | 24 | 230 | 36 | 166 | 50 | 131 | 63 | 103 | 81 | 91 | 91 |
| 5000 | 107 | 333 | 26 | 219 | 40 | 158 | 55 | 125 | 70 | 98 | 90 | 87 | 101 |
| 5500 | 105 | 327 | 29 | 215 | 44 | 156 | 61 | 122 | 77 | 96 | 98 | 86 | 111 |
| 6000 | 107 | 333 | 32 | 219 | 48 | 158 | 66 | 125 | 84 | 98 | 107 | 87 | 121 |
| 6500 | 114 | 355 | 34 | 234 | 52 | 169 | 72 | 133 | 91 | 104 | 116 | 93 | 131 |
| 7000 | 118 | 368 | 37 | 242 | 56 | 175 | 78 | 138 | 98 | 108 | 125 | 96 | 141 |
| 7500 | 115 | 358 | 39 | 236 | 60 | 170 | 83 | 134 | 106 | 105 | 134 | 94 | 151 |
| 8000 | 108 | 337 | 42 | 221 | 64 | 160 | 89 | 126 | 113 | 99 | 143 | 88 | 161 |
| 8500 | 91 | 284 | 45 | 187 | 68 | 135 | 94 | 106 | 120 | 83 | 152 | 74 | 171 |
| 9000 | 80 | 249 | 47 | 164 | 72 | 118 | 100 | 93 | 127 | 73 | 161 | 65 | 181 |